Chartanalysen Square - Fibonacci
Fibonacci-Numbers
Leonardo de Pisa, known as Fibonacci, is considered important mathematicians in the Middle Ages. His Fibonacci numbers or the sequence of numbers (0, 1, 1, 2, 3, 5, 8, 13, 21, 34, 55, 89, 144, 233, 377, ...) is probably his most famous heritage and among other things, the basis for a variety of tools in technical analysis.
The series of numbers starting with 0 and 1, and each subsequent number is the sum of its two predecessors.
The Fibonacci sequence in nature
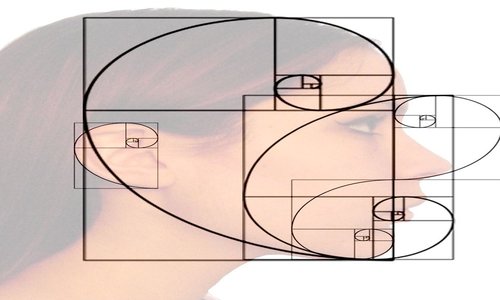
A very special aspect of the Fibonacci number series is the wide occurrence in nature. In flowers, Mussels and population calculations of animals you always discover the connection to the Fibonacci numbers. Fibonacci records of the modeling rabbit population make the connection with nature represents vividly Fibonacci is based on the following four conditions:
- Starting point is a pair of rabbits (mature)
- Newborn pairs are from the 2nd Months mature
- Every month a pair of rabbits does (sexually mature), a new pair of rabbits on the world
- Since this is a model situation, it is assumed that no rabbit "system" leaves and add None comes from outside
After a month, the first pair of rabbits gets directly offspring. For future months, is that each mature rabbit couple young gets, which means that each month as much newborn couples come to the world, have lived as couples in the previous month. The delay by one month results from the lack of sexual maturity the newborn.
For the first year of the rabbit population on a monthly basis, this gives the following sequence for the propagation first Year: 1 (Jan.), 2 (Feb.), 3 (March), 5 (Apr.), 8 (May), 13 (June), 21 (July), 34 (Aug.), 55 (Sep.), 89 (October), 144 (Nov.), 233 (dec) (1 +2 = 3, 2 +3 = 5, 3 +5 = 8, etc.). Theoretically, the population continues to grow, if you assumed the rabbit immortality.
The Fibonacci sequence in the technical analysis
In technical analysis used different tools that are based on the Fibonacci numbers are based, as a tool for forecast of price movement.
Particularly common, the
Fibonacci Retracements applied in practice. In an uptrend intact the 50% and the 61.8% retracement serves as The aim of a correction. The share price reaches this level, it is chart from a technical perspective is very likely that there The courses form a bottom and rise again in the direction of the prevailing trend. The same applies to Recovery moves in bear markets.
These retracement levels resulting indirectly from the Fibonacci series. If any number of the Fibonacci series divided by the next highest, obtained as a result always has a value close to ~ 0.618 (eg, 55: 89 = 0.61797)! When divided by the number from the series after the next is always a value close to ~ 0.382 (eg 55: 144 = 0.38194)! The higher the used Fibonacci numbers, the more accurate the results are approaching those limits at.


 www.godmode-trader.de